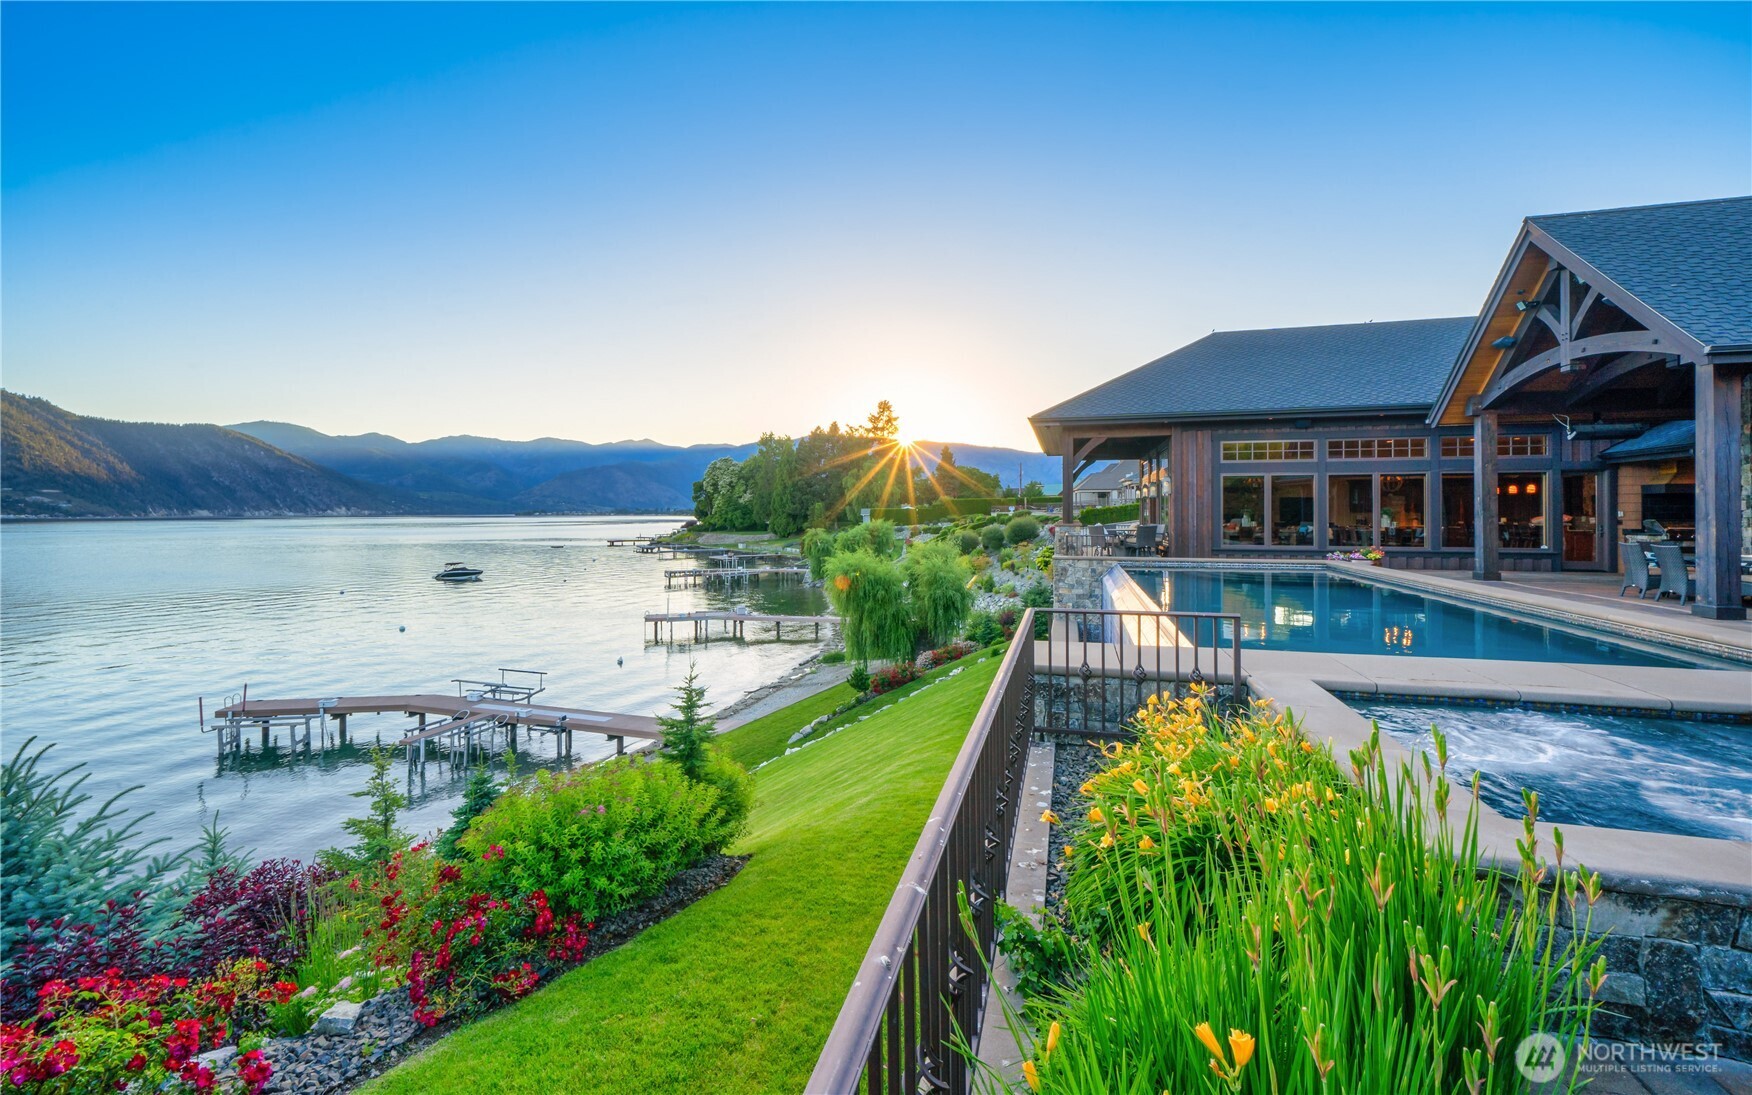
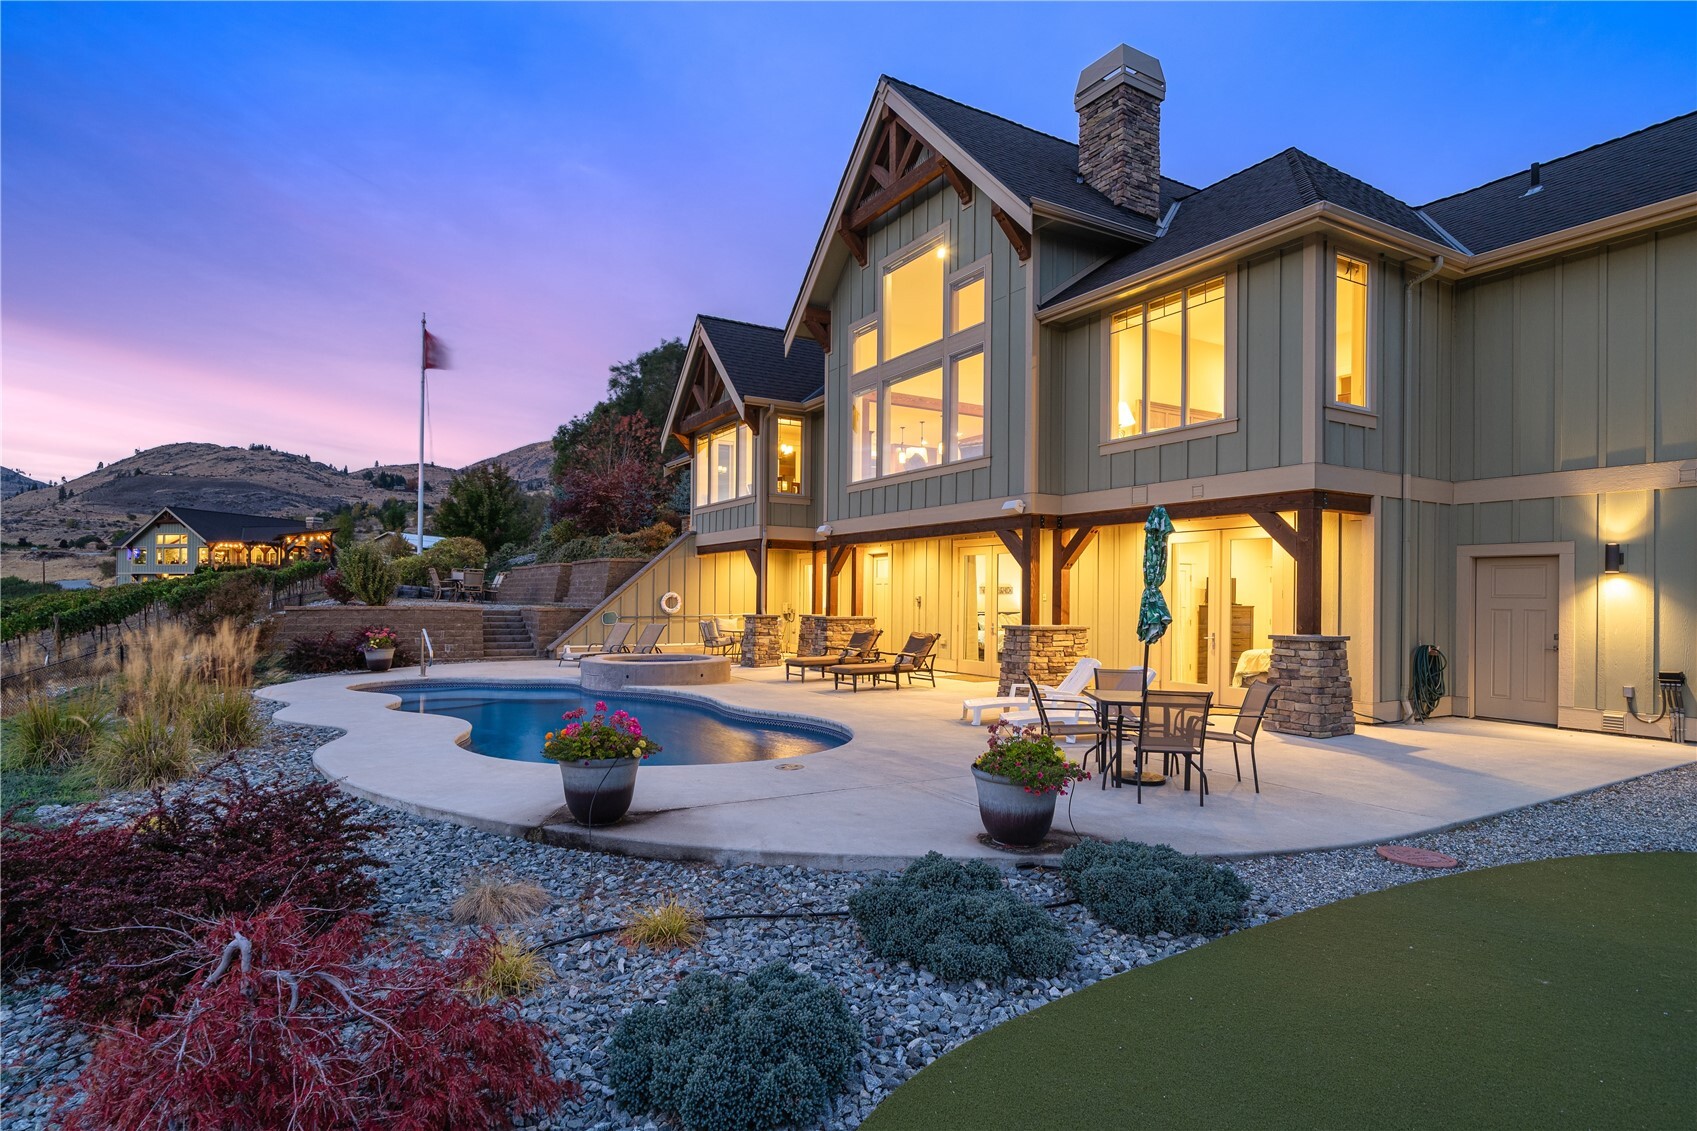
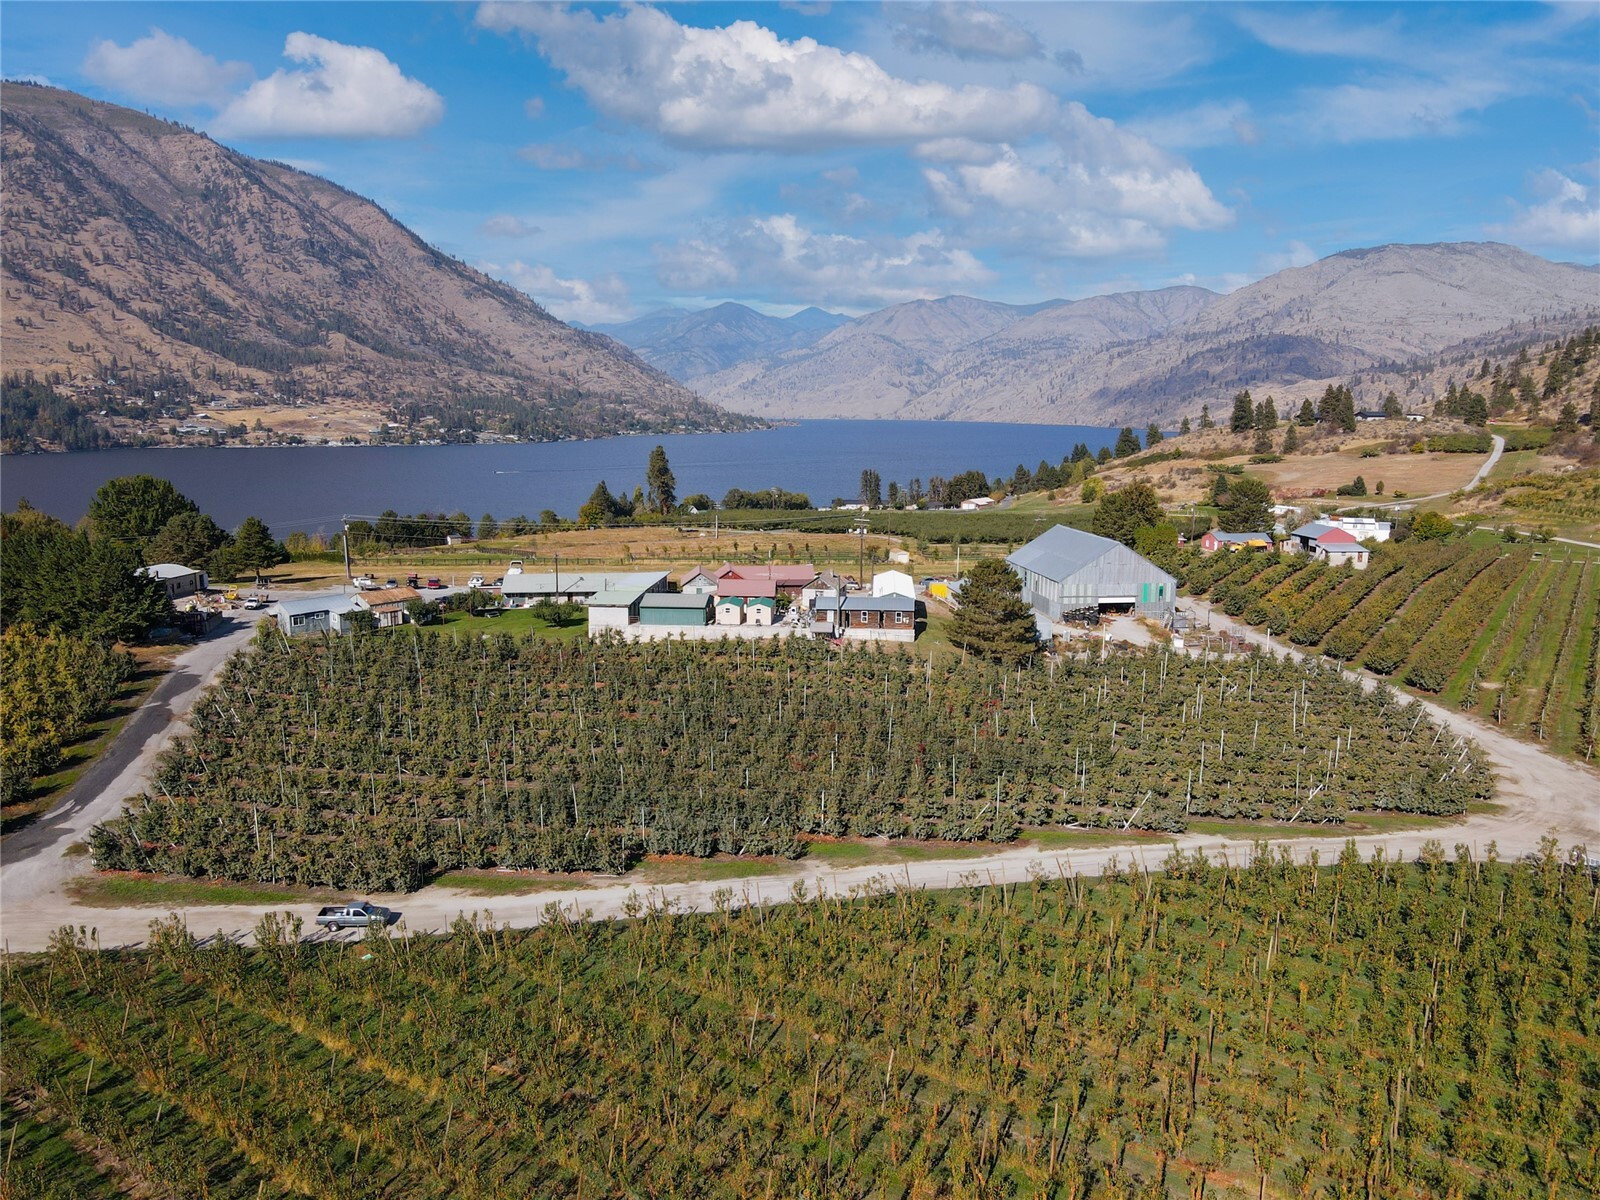
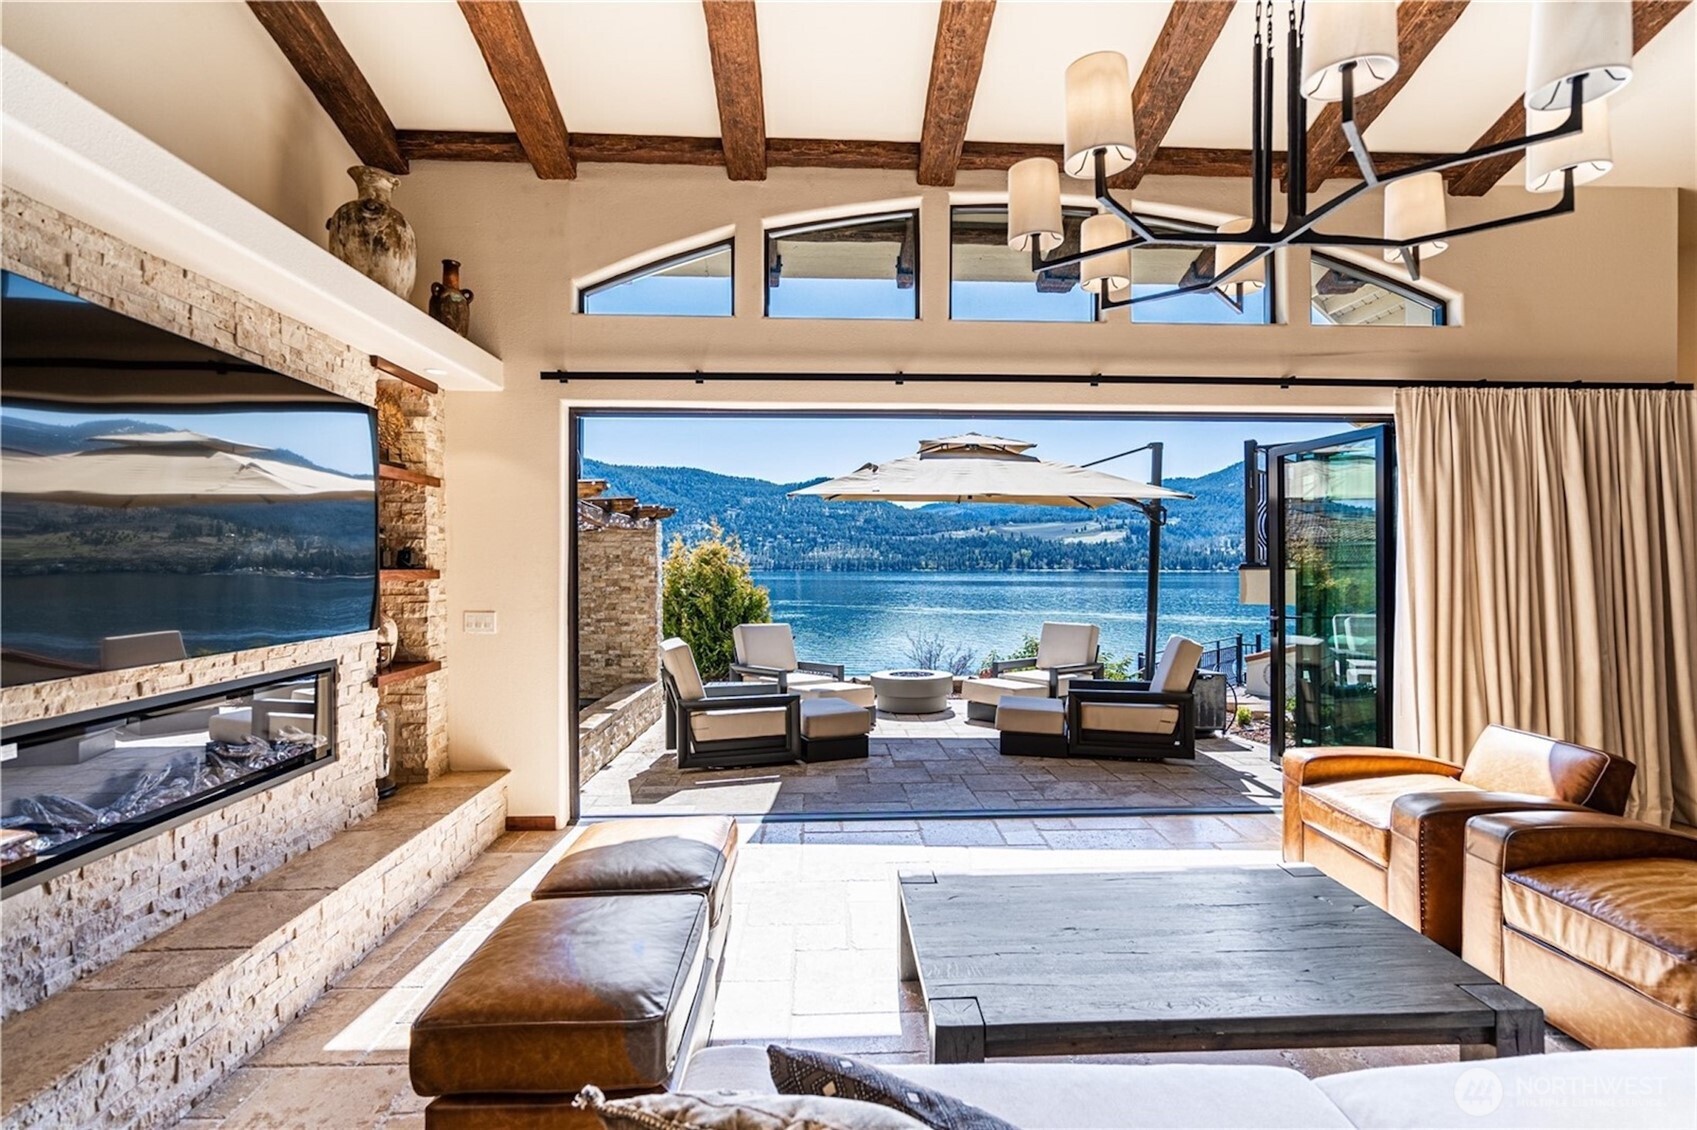
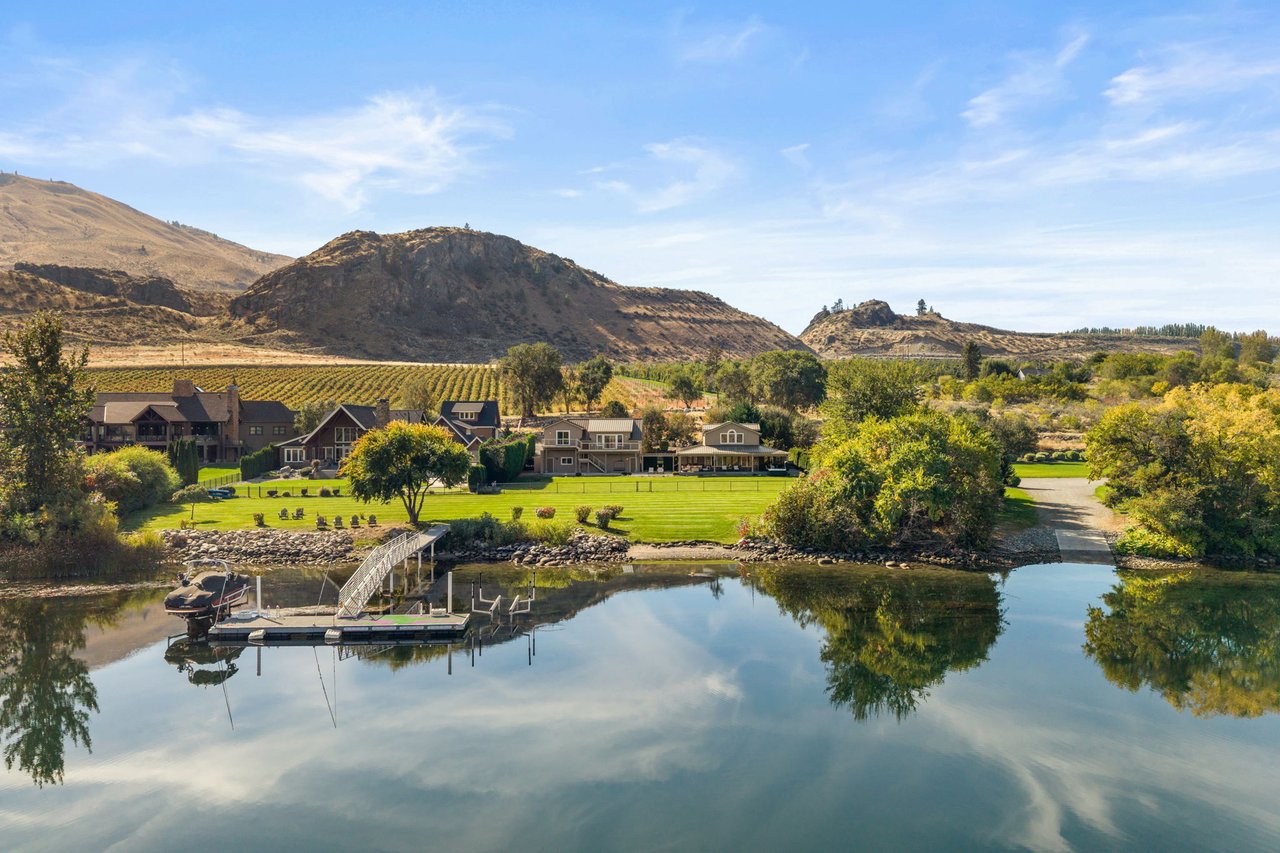
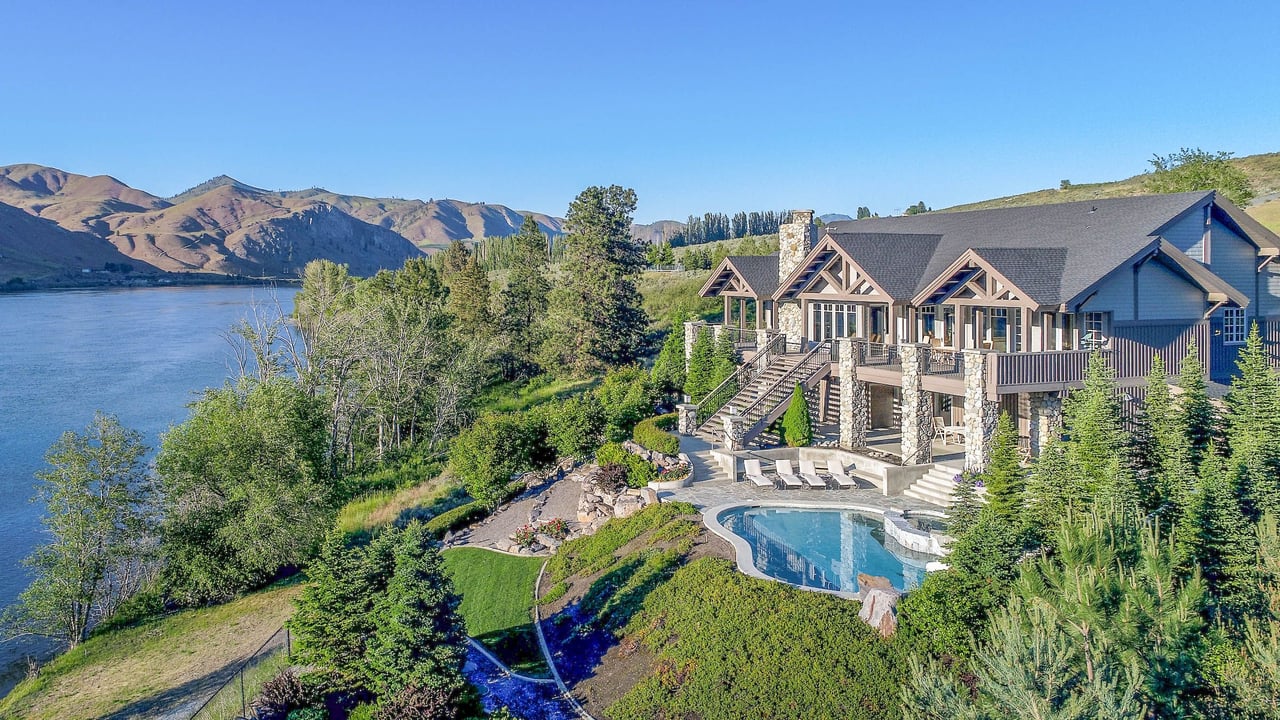
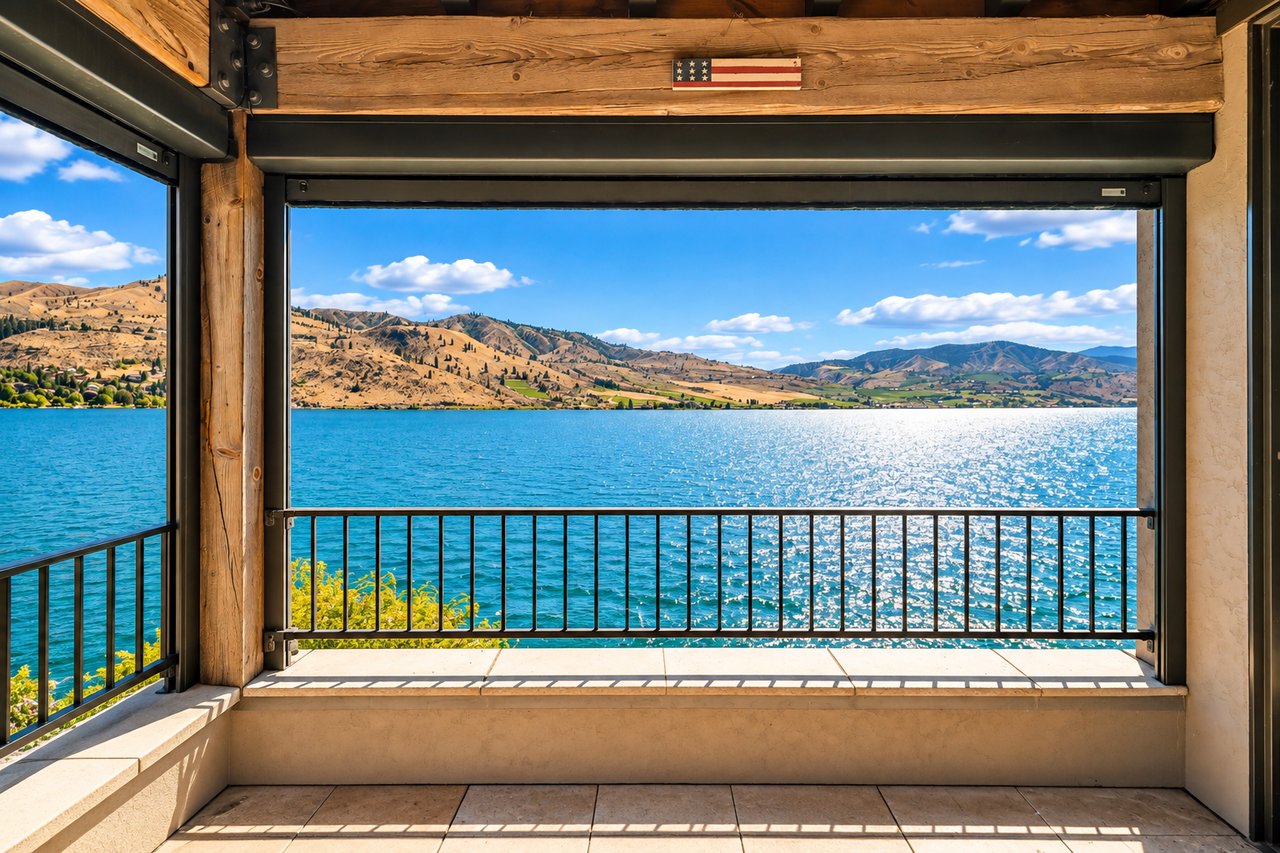
Manson waterfront homes occupy some of the most desirable shoreline on Lake Chelan. Located approximately seven miles uplake from the city of Chelan on the lake’s North Shore, Manson combines direct waterfront living, exceptional sun exposure, protected bays, private docks, vineyards and orchards with the atmosphere of a small lakeside community.
For buyers searching for a Lake Chelan waterfront home, Manson is one of the first areas I recommend exploring.
Location and orientation are two of Manson’s greatest advantages.
The Manson area sits along the north side of Lake Chelan, where many waterfront properties are oriented generally toward the south, southeast or southwest across the lake. Depending on the specific property and surrounding topography, that orientation can provide excellent exposure to the sun and long summer days along the waterfront.
On Lake Chelan, that matters.
A home’s orientation can dramatically affect how you experience the property. Two waterfront homes relatively close to one another can have very different afternoon sun, wind exposure, water depth, swimming conditions and beach access.
That is why I encourage buyers to evaluate Lake Chelan waterfront by the individual property—not simply by the view from the house.
Manson waterfront includes several distinctly different shoreline environments.
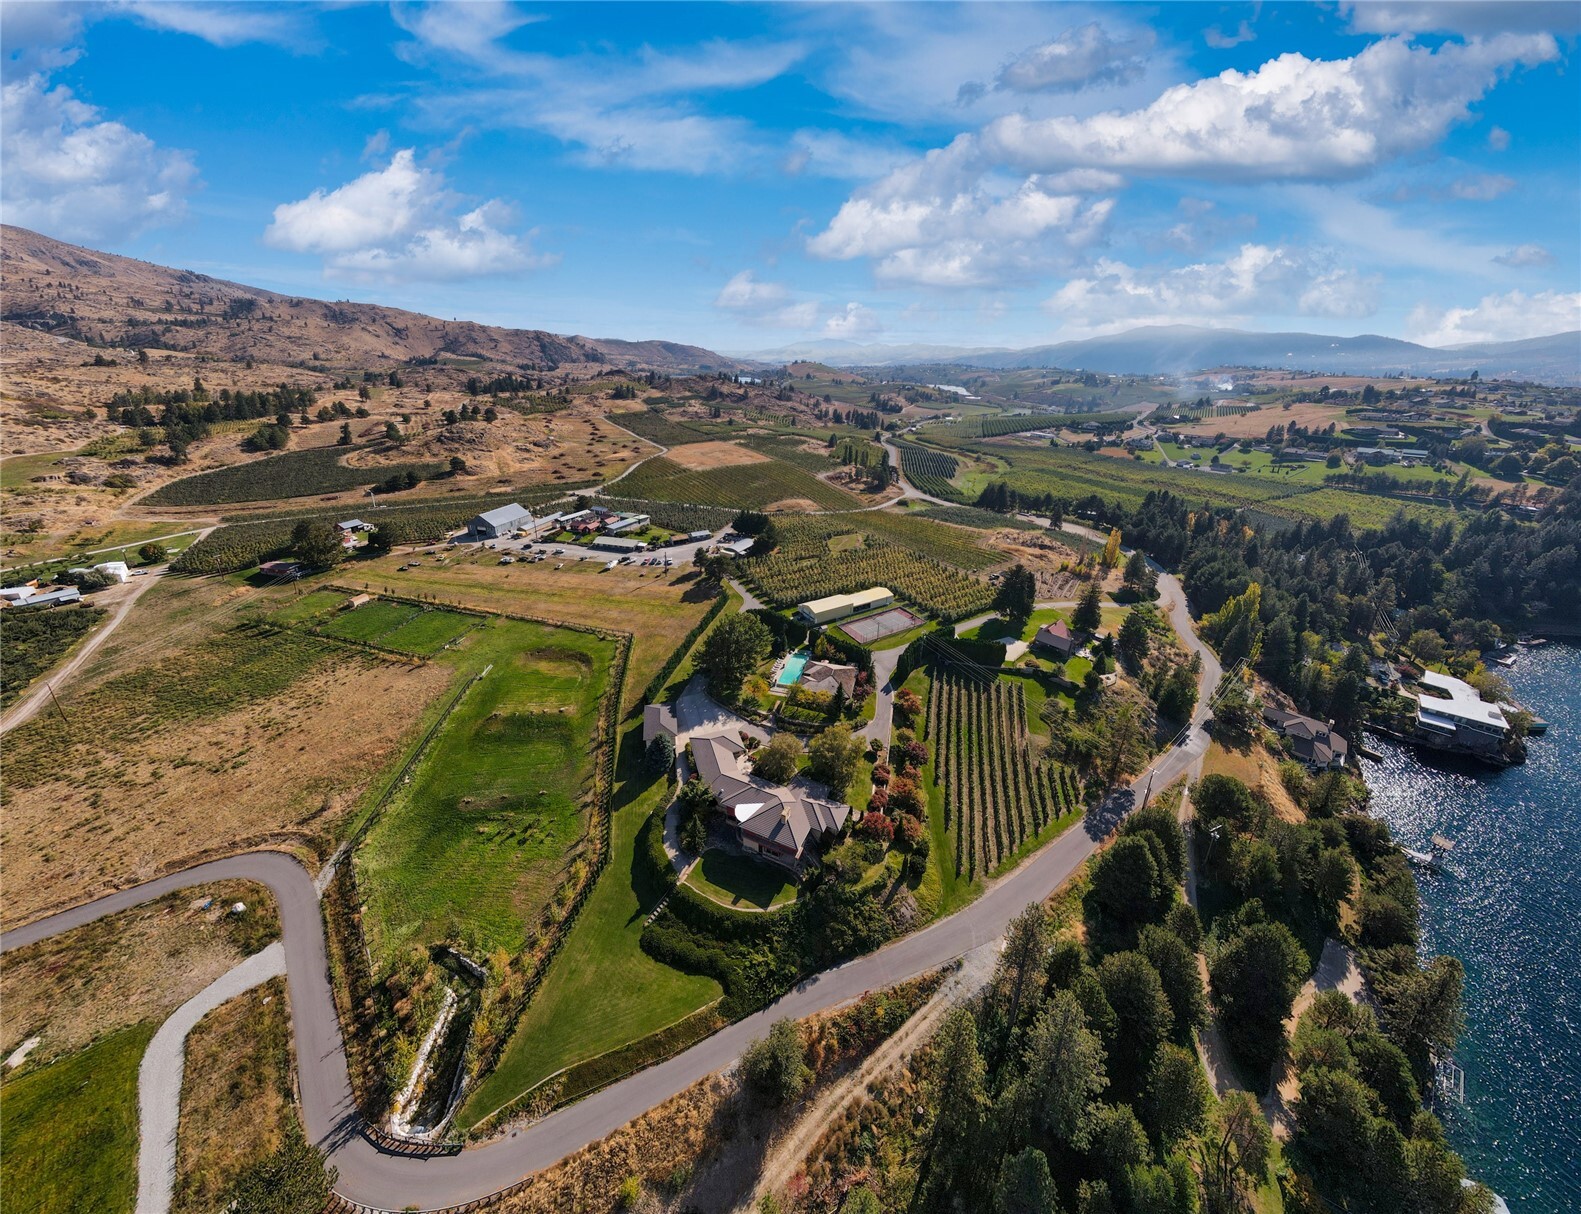
Manson Bay provides a protected setting close to downtown Manson, its marina and public waterfront. Wapato Point extends prominently into Lake Chelan and is known for its beaches, docks and broad views across the lake. The shoreline extending beyond Manson includes everything from established residential waterfront to larger parcels, vineyard properties and quieter stretches of Lake Chelan farther uplake.
This variety is one of the things that makes Manson waterfront real estate unique.
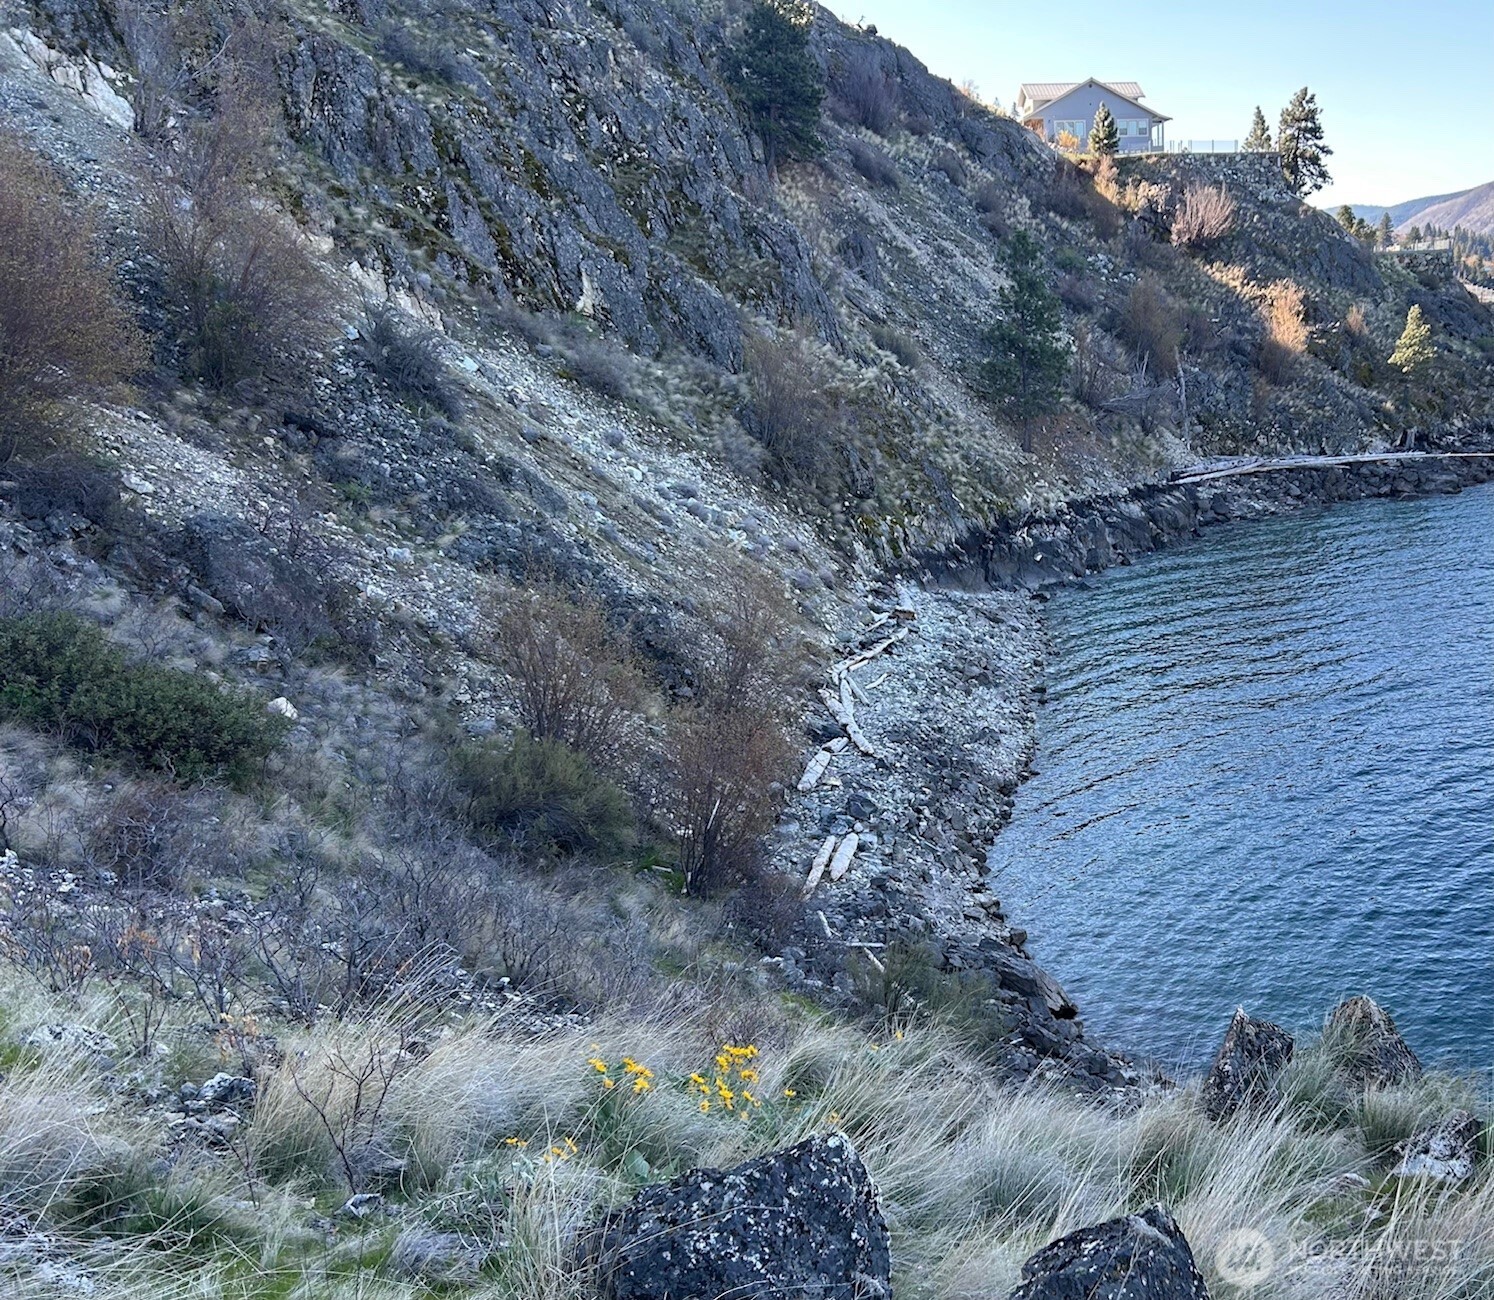
Buyers can find sandy or low-bank waterfront in certain locations, bulkheaded shoreline in others, protected coves and bays, and properties positioned directly on the larger body of Lake Chelan.
There is no single definition of a “Manson waterfront home,” which is precisely why local knowledge becomes so important when comparing properties.
Manson offers something that is increasingly difficult to find in resort communities: the ability to own waterfront while still feeling connected to a real small town.
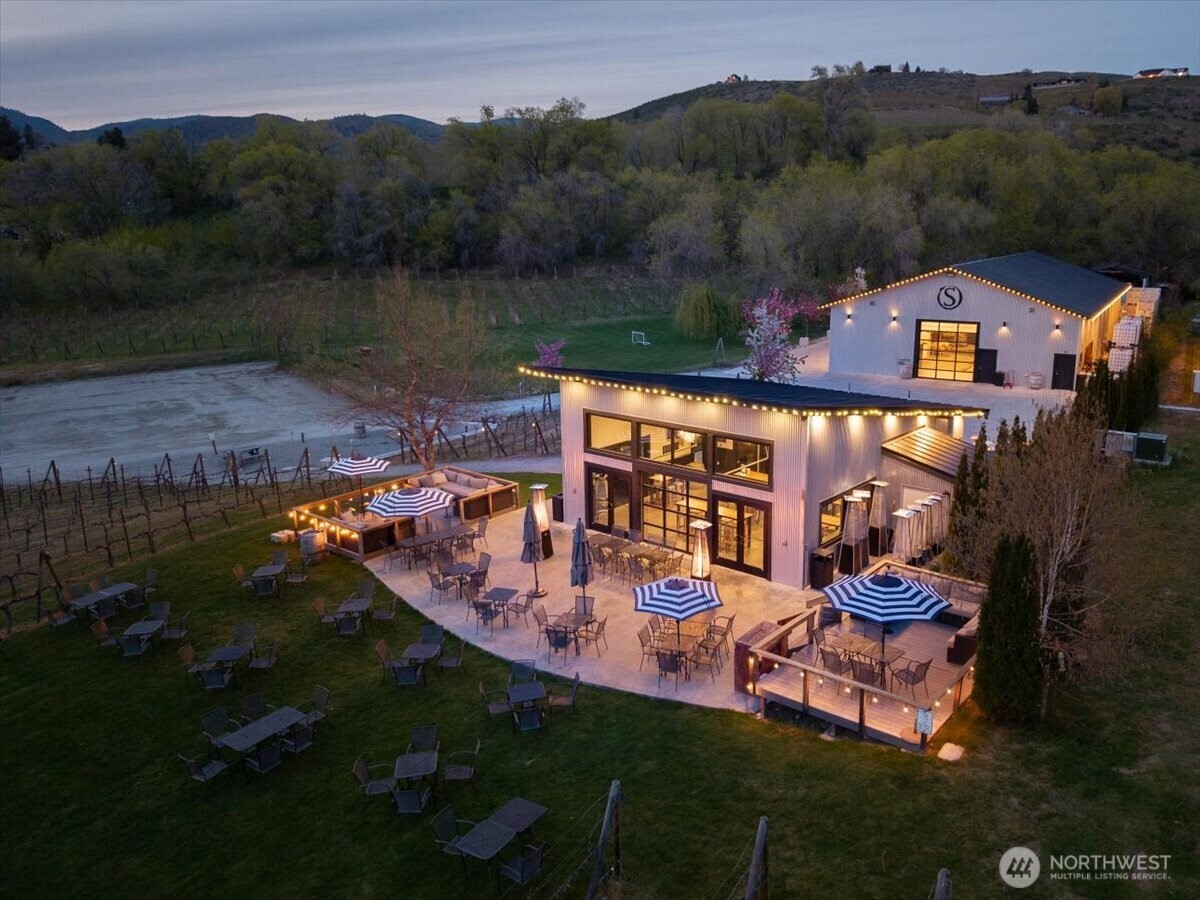
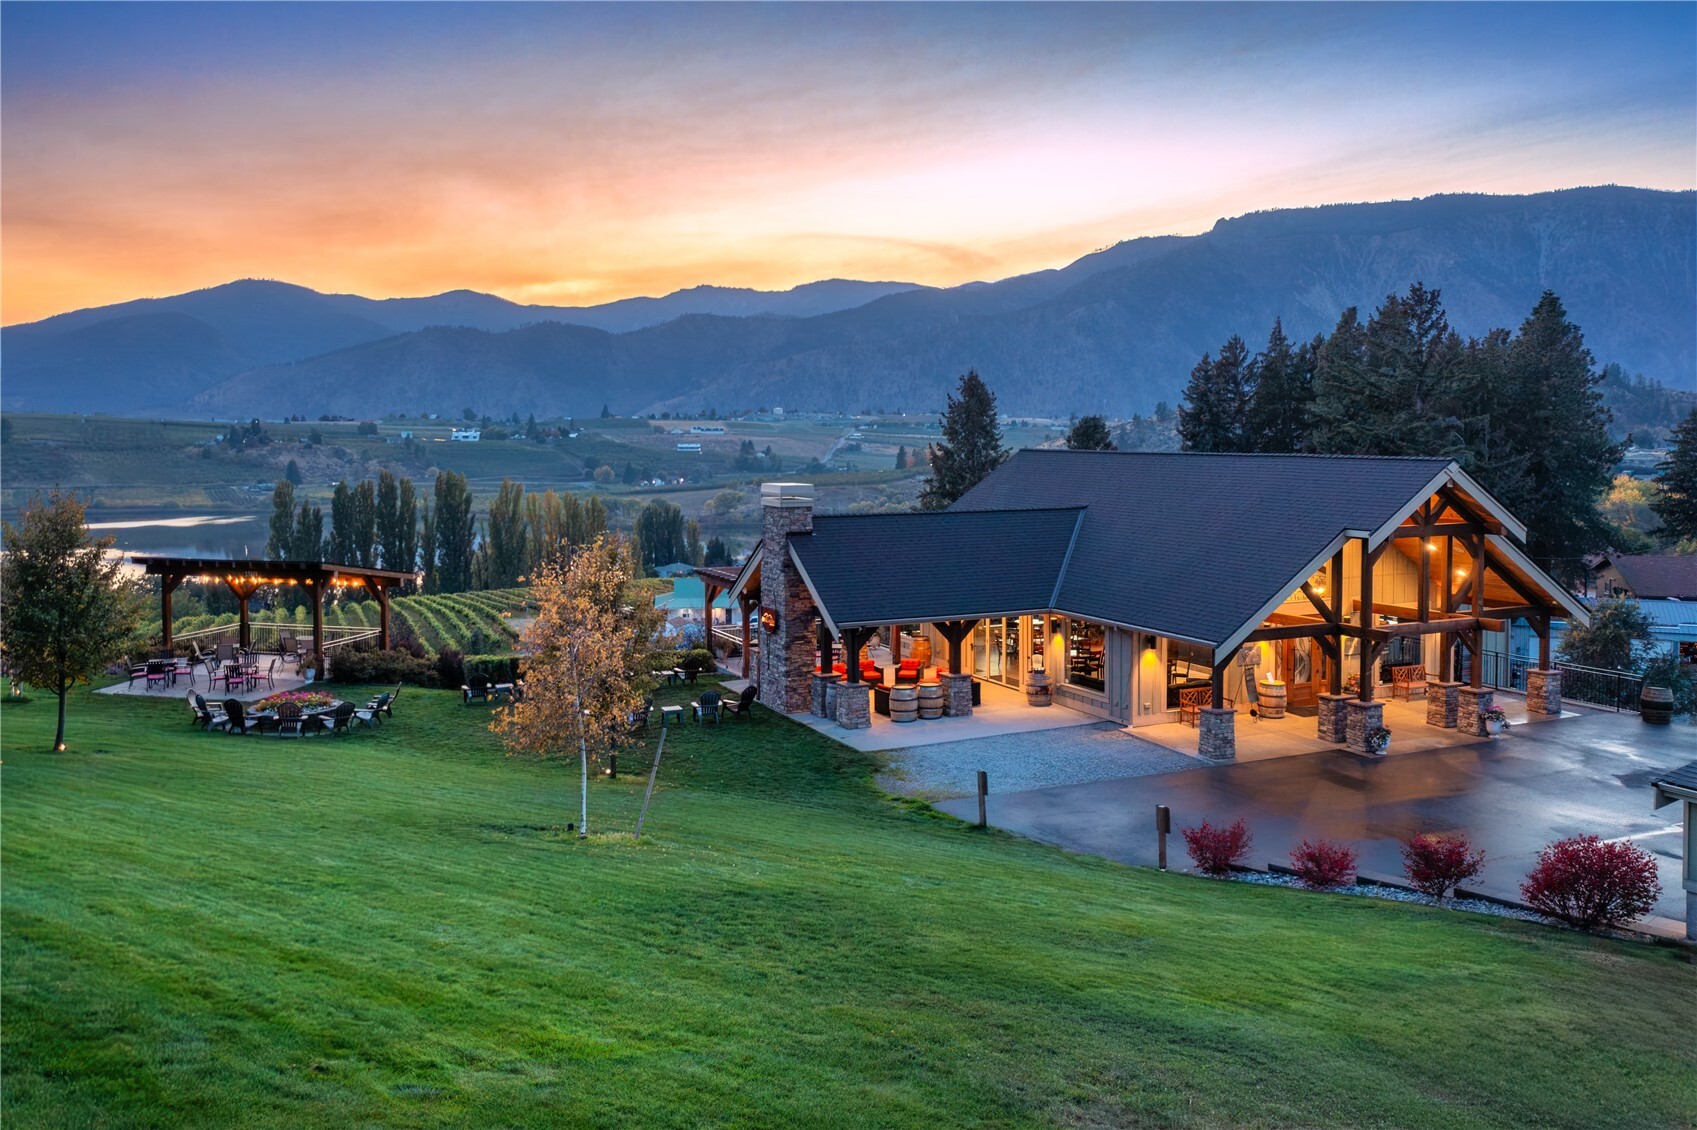
Downtown Manson sits directly beside Lake Chelan and is surrounded by wineries, tasting rooms, restaurants, parks and agricultural land. Orchards and vineyards remain an important part of the landscape and history of the community, giving this side of Lake Chelan a character distinctly different from more densely developed resort areas.
Wapato Point alone encompasses approximately 116 acres and 1.5 miles of Lake Chelan shoreline, while the greater Manson area is surrounded by wineries, vineyards, orchards and additional recreational lakes.
For many of my clients, Manson offers the balance they are looking for: a private waterfront home and dock, but with boating, wine country, restaurants and a genuine community only minutes away.
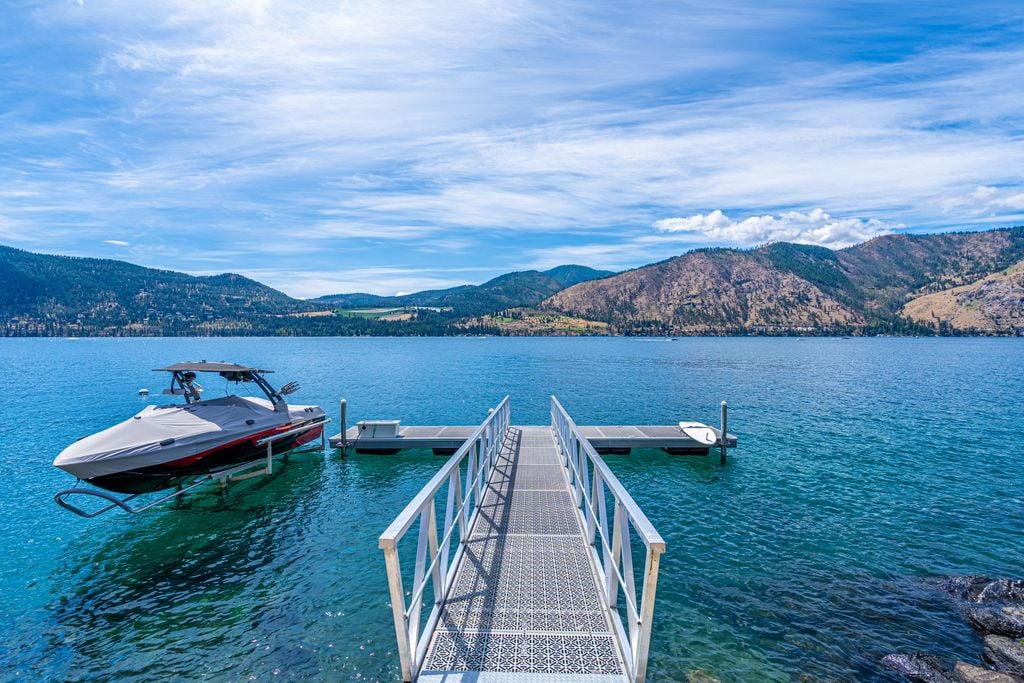
For many Lake Chelan waterfront buyers, the dock is nearly as important as the house.
Private docks and boat lifts can transform how a property is used, but buyers should understand that waterfront properties can differ significantly in water depth, shoreline configuration, dock construction, permitting history and seasonal conditions.
When I evaluate a Manson waterfront property for a client, I look well beyond square footage and finishes.
I pay attention to:
Those characteristics can have an enormous impact on both enjoyment and value.
One of the defining characteristics of Manson waterfront real estate is scarcity.
Lake Chelan has a finite shoreline, and only a portion of it combines private residential ownership with the characteristics most luxury buyers want: usable waterfront, favorable sun exposure, a quality dock, privacy, good swimming conditions and convenient access to Manson or Chelan.
The supply becomes even smaller when a buyer is specifically searching for a low-bank or no-bank waterfront home with a private dock.
As a result, the best Manson waterfront properties may not become available very often. Buyers focused on a particular section of shoreline, neighborhood or property type should be prepared before the right opportunity appears.
The numbers bear that out. Over the last three years only 24 single-family waterfront homes have closed in Manson — about eight a year — at a median of $1,965,000 and $755 per square foot, the highest median of any city on the lake. In the most recent twelve months, 8 sold at a median of $2,212,500.
12 months ending Aug 31 | Homes sold | Median sold price | Average sold price | Price range | Median $/sq ft | Avg days on market | Dollar volume |
|---|---|---|---|---|---|---|---|
Sep 2023–Aug 2024 | 5 | $1,980,000 | $2,683,000 | $1.10M – $5.90M | $660 | 45 | $13.4M |
Sep 2024–Aug 2025 | 11 | $1,700,000 | $2,163,091 | $0.34M – $4.75M | $734 | 94 | $23.8M |
Sep 2025–Aug 2026 | 8 | $2,212,500 | $2,421,250 | $0.85M – $5.15M | $871 | 80 | $19.4M |
3-year total | 24 | $1,965,000 | $2,357,458 | $0.34M – $5.90M | $755 | 79 | $56.6M |
Source: Northwest MLS (NWMLS), closed sales of single-family waterfront homes in Manson, WA, September 1, 2023 – August 31, 2026. Condominiums and vacant land excluded. Compiled by Justin Skaar, September 2026; refreshed annually.
I live in Manson and have sold real estate throughout the Lake Chelan Valley for more than two decades.
That experience has taught me that Lake Chelan waterfront cannot be properly evaluated from an MLS listing alone.
A beautiful photograph doesn’t tell you when the beach goes into shade. Square footage doesn’t tell you whether the afternoon wind hits the dock. An aerial photograph may not reveal how quickly the lake bottom drops away, how usable the shoreline is for children and swimming, or what boating conditions are like on a summer afternoon.
These details matter—especially when purchasing a multi-million-dollar Lake Chelan waterfront property.
My job is to help buyers understand not only what a Manson waterfront home is worth today, but why one property may deserve a premium over another and how those differences are likely to affect its long-term desirability.
If you are considering a waterfront home in Manson, Washington, I can help you evaluate properties throughout Manson Bay, Wapato Point, the North Shore and the surrounding Lake Chelan waterfront.
Whether you are searching for a luxury waterfront estate, a low-bank home with a private dock, a family lake house, a vineyard waterfront property or a legacy property to hold for generations, the search should begin with understanding which section of Lake Chelan best fits the way you want to use the lake.
Some of the most desirable opportunities can also be difficult to find through a typical online search.
Contact Justin Skaar with Marketplace Sotheby’s International Realty for current Manson waterfront homes for sale, upcoming listings and insight into Lake Chelan waterfront properties that may not yet be publicly marketed.
Explore more: Chelan Waterfront · Lake Entiat Waterfront · All Manson Homes
Based on information submitted to the MLS GRID as of . All data is obtained from various sources and may not have been verified by the broker or MLS GRID. Supplied Open House Information is subject to change without notice. All information should be independently reviewed and verified for accuracy. Properties may or may not be listed by the office/agent presenting the information.
4,020 people live in Manson Waterfront, where the median age is 46.2 and the average individual income is $44,126. Data provided by the U.S. Census Bureau.
Total Population
Median Age
Population Density Population Density This is the number of people per square mile in a neighborhood.
Average individual Income
There's plenty to do around Manson Waterfront, including shopping, dining, nightlife, parks, and more. Data provided by Walk Score and Yelp.
Explore popular things to do in the area, including Tipsy Canyon Winery, Tildio Winery, and Four Lakes Winery.
| Name | Category | Distance | Reviews |
Ratings by
Yelp
|
|---|---|---|---|---|
| Dining · $$ | 1.92 miles | 32 reviews | 4.4/5 stars | |
| Dining · $$ | 1.96 miles | 32 reviews | 4.2/5 stars | |
| Dining · $$ | 2.2 miles | 30 reviews | 4/5 stars | |
| Dining · $$ | 2.62 miles | 99 reviews | 4.1/5 stars | |
| Dining | 2.66 miles | 8 reviews | 4.9/5 stars | |
| Dining | 2.66 miles | 3 reviews | 5/5 stars | |
| Dining | 2.8 miles | 0 reviews | 0/5 stars | |
| Dining · $$ | 2.99 miles | 34 reviews | 4.7/5 stars | |
| Dining · $$ | 3.03 miles | 612 reviews | 3.9/5 stars | |
| Dining · $$ | 3.11 miles | 12 reviews | 4.4/5 stars | |
| Dining · $$ | 3.15 miles | 2 reviews | 4/5 stars | |
| Dining | 3.31 miles | 10 reviews | 5/5 stars | |
| Dining | 3.31 miles | 0 reviews | 0/5 stars | |
| Dining · $$ | 3.33 miles | 9 reviews | 4.8/5 stars | |
| Dining | 3.37 miles | 0 reviews | 0/5 stars | |
| Dining | 3.38 miles | 0 reviews | 0/5 stars | |
| Dining · $$ | 3.39 miles | 0 reviews | 0/5 stars | |
| Dining | 3.39 miles | 0 reviews | 0/5 stars | |
| Active | 1.98 miles | 1 review | 5/5 stars | |
| Active | 2.29 miles | 13 reviews | 2.6/5 stars | |
| Active | 2.59 miles | 0 reviews | 0/5 stars | |
| Active | 2.8 miles | 30 reviews | 4.4/5 stars | |
| Active | 3.1 miles | 0 reviews | 0/5 stars | |
| Beauty | 2.97 miles | 0 reviews | 0/5 stars | |
|
|
||||
|
|
||||
|
|
||||
|
|
||||
|
|
||||
|
|
Manson Waterfront has 1,357 households, with an average household size of 2.87. Data provided by the U.S. Census Bureau. Here’s what the people living in Manson Waterfront do for work — and how long it takes them to get there. Data provided by the U.S. Census Bureau. 4,020 people call Manson Waterfront home. The population density is 85 and the largest age group is Data provided by the U.S. Census Bureau.
Total Population
Population Density Population Density This is the number of people per square mile in a neighborhood.
Median Age
Men vs Women
Population by Age Group
0-9 Years
10-17 Years
18-24 Years
25-64 Years
65-74 Years
75+ Years
Education Level
Total Households
Average Household Size
Average individual Income
Households with Children
With Children:
Without Children:
Marital Status
Blue vs White Collar Workers
Blue Collar:
White Collar:
Manson Waterfront has 1,357 households, with an average household size of 2.87. Data provided by the U.S. Census Bureau. Here’s what the people living in Manson Waterfront do for work — and how long it takes them to get there. Data provided by the U.S. Census Bureau. 4,020 people call Manson Waterfront home. The population density is 85 and the largest age group is Data provided by the U.S. Census Bureau.
Total Population
Population Density Population Density This is the number of people per square mile in a neighborhood.
Median Age
Men vs Women
Population by Age Group
0-9 Years
10-17 Years
18-24 Years
25-64 Years
65-74 Years
75+ Years
Education Level
Total Households
Average Household Size
Average individual Income
Households with Children
With Children:
Without Children:
Marital Status
Blue vs White Collar Workers
Blue Collar:
White Collar: